Phenomics - Coding x Flow Cytometry
My portfolio on how I used coding to help discover insight from flow cytometric result.

Introduction
As a proud member of the Siriraj Center of Research Excellence for Systems Pharmacology (SiSP), I’m driven by a passion for uncovering the secrets of cancer biology. My research combines hands-on laboratory work with advanced data analysis, specializing in flow cytometric analysis.
I’ve performed cell sorting and multi-color flow cytometry to explore novel relationships between our recently proven CCA CSC reporter and known protein surface markers. This work was made possible with the invaluable guidance of my co-advisors, Assoc. Prof. Dr. Methchit Wattanapanich (Siriraj Center for Regenerative Medicine(SiCRM)), Assoc. Prof. Dr. Adisak Wongkajornsilp (SiSP), and Emerita Prof. Dr. Marianne Hokland (Aarhus University, Denmark🇩🇰). I dive deep into the resulting data using RStudio, where I perform exploratory data analysis to ensure that every experiment tells a complete and compelling story.
1. Analysis overview:
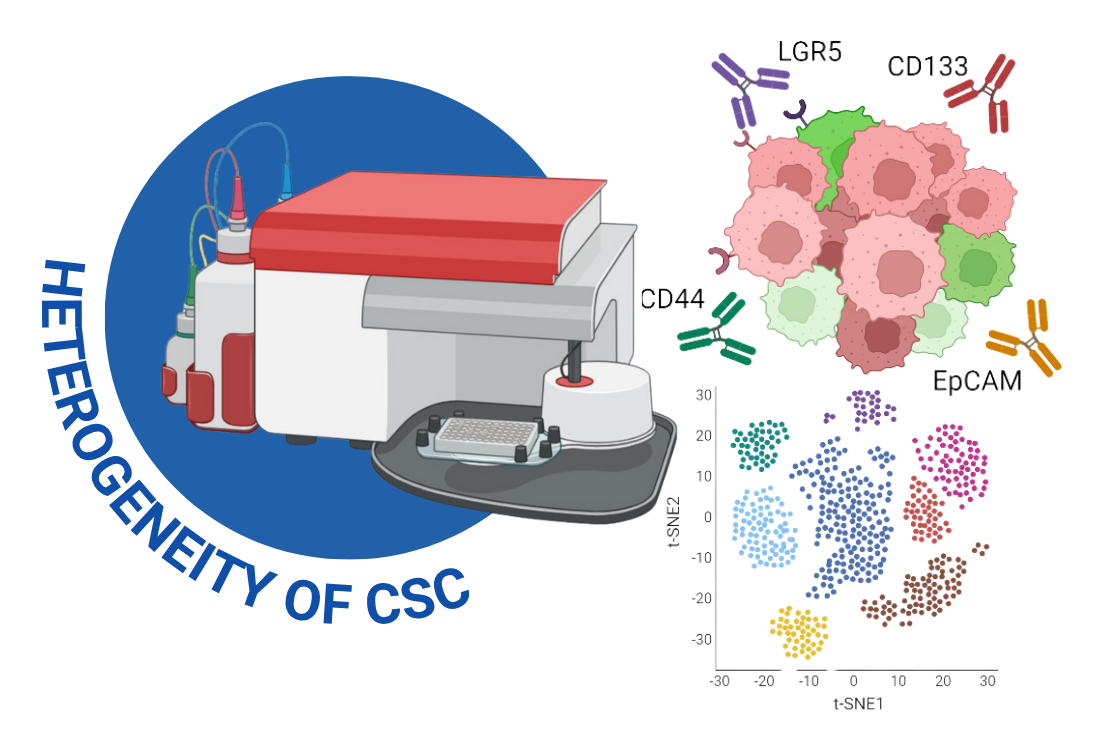
To investigate the dynamic nature of cancer stem cells (CSCs) in cholangiocarcinoma (CCA), I employed a multi-faceted approach centered on flow cytometric analysis. This research utilized a novel live single-cell reporter system (SORE6-dsCopGFP) to identify a subpopulation of CSC-like cells (SORE6POS) in real-time. My work involved using cell sorting and multi-color flow cytometry to explore the relationships between these reporter-positive cells and established protein surface markers, such as CD133, CD44, LGR5, and EpCAM. This advanced analysis allowed me to move beyond static observations and study the plasticity and hierarchical staging of CSCs at the single-cell level.
2. Key Applications:
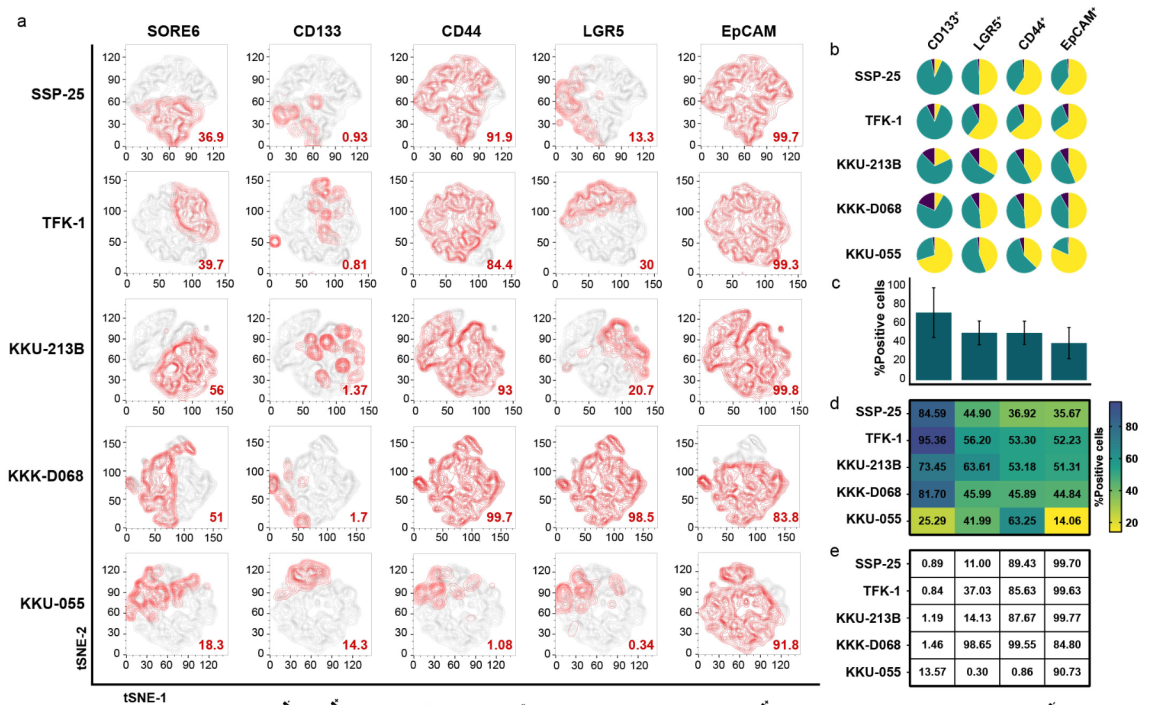
2.1 Investigating CSC Phenotype: Used multiplex flow cytometry and t-distributed Stochastic Neighbor Embedding (t-SNE) analysis to explore the activities of SOX2/OCT4 in CCA cells expressing CSC-related surface markers. I found that SORE6POS cells, identified by the reporter system, coincided with the CD133-positive population, indicating that these cells represent a CCA subpopulation with active SOX2/OCT4.
😁😁 I am very exciting to discover this with coding and exploratory data analysis (EDA). It is a ton of data at the starting point.😁😁


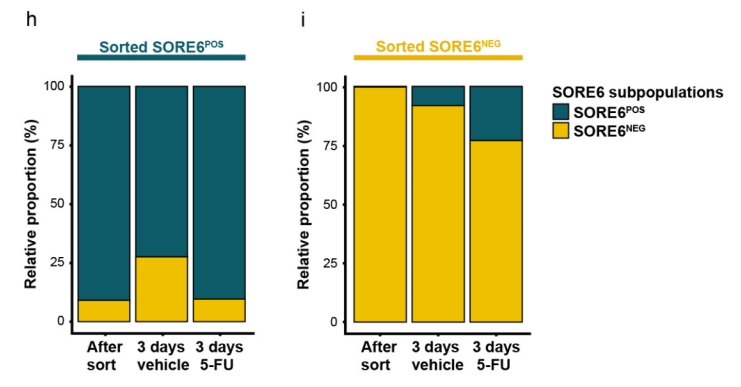
2.2 Analyzing CSC Plasticity: Fluorescence-activated cell sorting (FACS) was conducted to separate SORE6POS and GFP-negative (SORE6NEG) cells, revealing key aspects of their plasticity.
- Spontaneous plasticity: We demonstrated that SORE6POS cells can spontaneously differentiate into SORE6NEG cells, and vice versa, which reveals the highly plastic nature of the CCA CSCs.


- Drug-induced plasticity: The drug 5-FU was shown to induce dedifferentiation in SORE6NEG cells while simultaneously suppressing the differentiation of SORE6POS cells.

3. Methods and Tools:
-
Wet Lab: Generated and cultured CCA cell lines containing the SORE6-dsCopGFP live reporter system.
-
Flow Cytometric Analysis: Utilized fluorescence-activated cell sorting (FACS) to isolate specific cell populations and performed multi-color flow cytometry to identify and characterize the expression of CSC-related surface markers.
-
Data Analysis: Performed exploratory data analysis (EDA) of the flow cytometry data using RStudio to draw meaningful conclusions about CSC plasticity, drug resistance, and the relationships between various markers.
4. What I’ve Learned
🧪 Flow cytometry generates immense amounts of data. Without coding, a thorough analysis of this data would be impossible, and it would be challenging to extract meaningful insights. My work required me to look beyond a single marker to understand the complex relationships within the CSC population, particularly when examining co-expression of multiple markers like CD133+CD44+ and CD133+LGR5+.
🧪 To achieve this, coding became a critical tool, allowing me to perform powerful EDA. I was inspired by “the gorilla experiment” in the publication “A hypothesis is a liability”. The experiment demonstrates that when you are focused on a specific task, you can completely miss something obvious that isn’t part of your plan. Similarly, with large flow cytometry datasets, a narrow focus can blind you to unexpected discoveries.
🧪 This curiosity about data exploration to discover new things was a topic of an email to Prof. Yanai, where I shared my preliminary data and my desire to go beyond a hypothesis-driven approach. I also mentioned the use of a pie chart, a seemingly simple figure that proved to be a crucial step in visualizing the distribution of different cell populations. The coding enabled me to create these powerful data visualizations, which provided meaningful insights for my EDA. Ultimately, coding didn’t just speed up the analysis; it enabled me to uncover subtle details of CSC biology and their role in drug resistance that would have otherwise been missed.
Acknowledgement
-
I would like to thank my co-authors and colleagues.
🏀 Nontaphat Thongsin, A valued colleague and friend from SiCRM. He was instrumental in setting up the wet lab for multi-color flow cytometric analysis and consistently offered invaluable insights on FlowJo analysis and its applications.
🏀 Allergen lab in our Pharmacology Department: I would called them “Fantastic4”, they provided foundational guidance during my earliest flow cytometric experiments. I also borrowed many chemical and plasticwares from them! -
I would like to thank my teachers and my co-advisors.
🚀 Emerita Prof.Dr. Marianne Hokland🇩🇰, A distinguished immunologist whose expertise was crucial in shaping the flow cytometric experiments. Her comments and suggestions were particularly helpful during the publication and revision stages.
🚀 Assoc.Prof.Dr. Adisak Wongkajornsilp An immunologist who, along with his team, provided foundational guidance during my earliest flow cytometric experiments.
🚀 Asst.Prof.Dr. Methichit Wattanapanitch Provided intensive and exclusive discussions on the topic from the perspective of healthy stem cells. - 🧩 Prof.Dr. Itai Yanai - Thank you for the profound insight from the “gorilla experiment,” which inspired me to embrace a more hypothesis-free approach to data exploration.
- 🛟 Lastly, I would like to thank my Ph.D. advisor, Assoc.Prof.Dr. Siwanon Jirawatnotai. Without him, I would not have discovered the exciting world of cancer biology. 🌞🌞 From that point, I expanded my interest to the -omic fields (including Phenomics) for a deeper understanding. 🤩🤩
Last note from me
- I’m sorry for coding resource. I will upload the R code to my GitHub as soon as possible. It is my very first coding projects. I was practicing by doing real-world data analysis (Yes!, my Ph.D. thesis). I didn’t have any support from an LLM at that time.
I’m very happy 🥰 that you are visiting my computational biology portfolio and would be even happier if you could provide suggestions or feedback 🤩.
You can contact me through various online platforms here 📬 or leave a comment below using GitHub account. 👇🏼
